and then turns into resistance again...
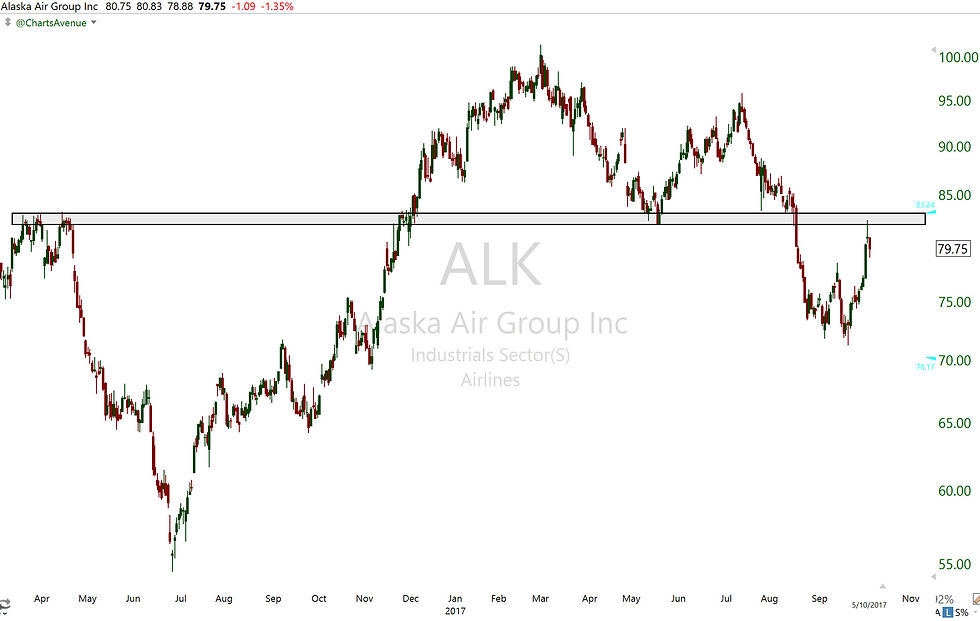
Here's the Daily chart:
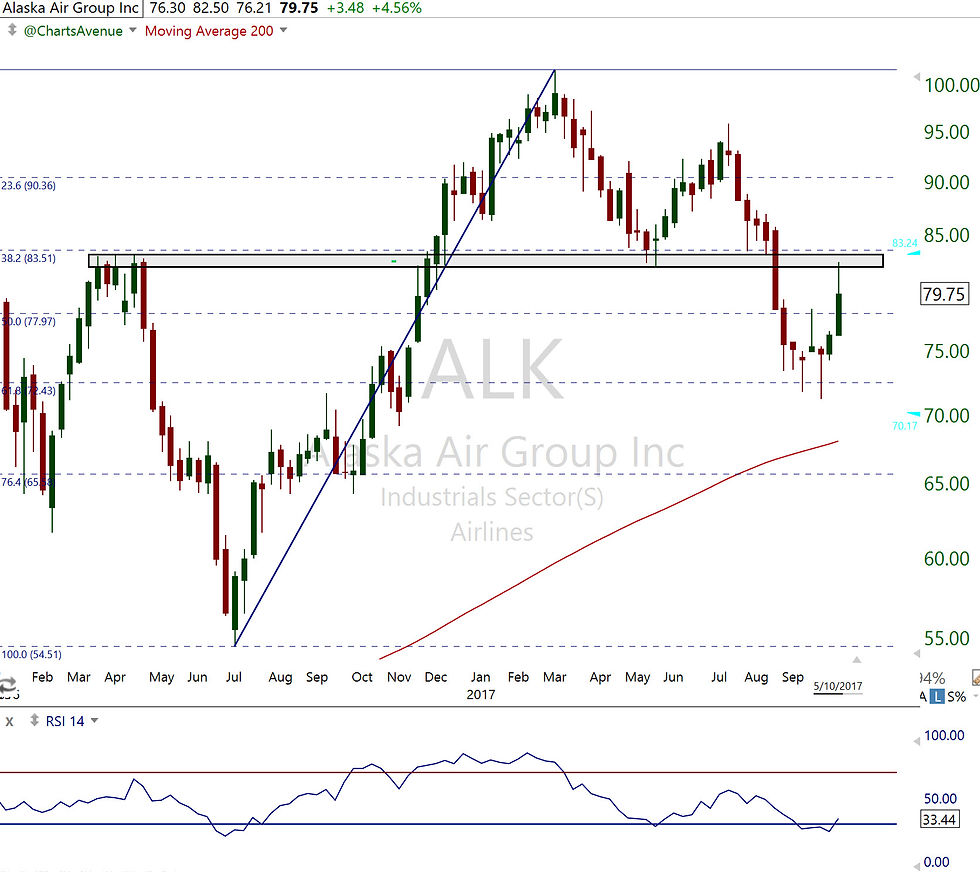
Check out the Weekly chart... although the week is not over yet... The Fibonacci retracement from 2016 low to 2017 high confirms the support to resistance at $83.50 (38.2 retracement). Even if $ALK is able to break that level, it will still remain in a downtrend channel. The 200MA pointing higher remains a good argument for the bulls. Let's see what $ALK will do today...